Chart Elements
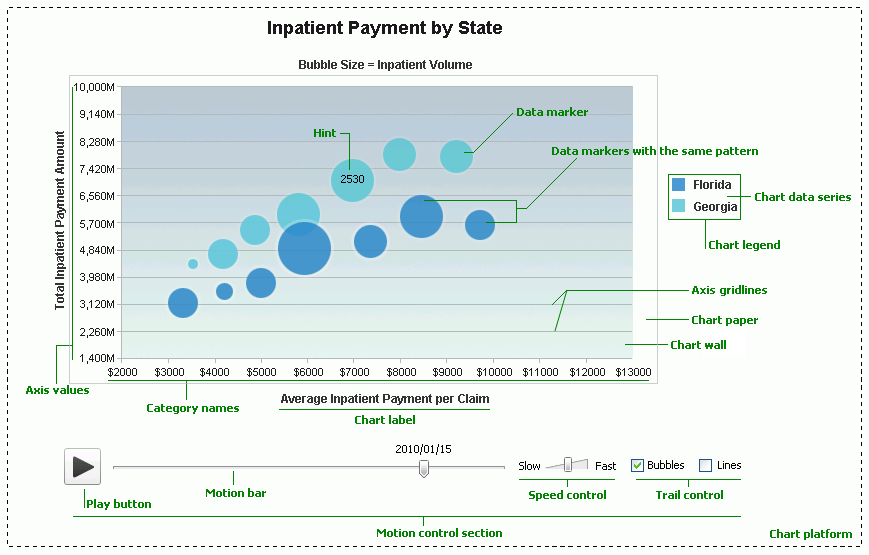
In a report template, a chart consists of three basic areas: the platform, paper, and legend. This topic introduces the elements a chart may contain.

- Chart platform
The container of other chart elements, such as chart paper and chart legend. - Chart wall
The area that graphically displays the data being charted. - Chart paper
The canvas on which the main chart is drawn. The chart paper contains walls, axes, data markers, axis values, and category names. - Chart legend
Chart legend is a box to identify the patterns or colors assigned to the data categories or series in a chart, or the colors assigned to the value ranges of a chart such as an indicator or bubble gauge chart. A chart legend may contain one or more legend entries, and each entry is composed of a mark and a label. You can show or hide the legend on a chart using shortcut menu command. Organization and stock charts do not have legend. - Chart label
You can use a chart label as the chart title or axis title. You can insert a label anywhere inside a chart. - Axis values
Each axis is divided by some tick marks, and each tick mark is associated with a value which is by default along the axis. - Axis gridlines
Lines that extend from the tick marks on an axis across the wall of a chart. They help readers of the chart easily find out what value is represented by a tick mark. - Category names
You can use DBField and formula values as category names. - Data series names
You can use DBField and formula values as series names. - Data markers
Data markers with the same pattern represent one data series. Each data marker represents one value from the chart data. - Hint
A hint message that displays the value of a data marker when you point to the data marker in Designer view mode, in HTML output, or at runtime. - Motion control section
A section of a motion chart. It contains the following elements, which you can use to make a chart move based on the value changes of the motion field bound in the motion bar.- Play button
The play button controls whether the chart is moving or static. - Motion bar
The motion bar is bound with a motion field. When the value of the motion field changes, the chart displays its dynamic trend. - Speed control
It enables you to control the moving speed of the chart. - Trail control
Available to bubble charts only. It controls whether the chart shows a trail of previous values in bubbles or lines.
- Play button
 Previous Topic
 Back to top