Inserting Crosstabs in a Report
You can create crosstabs in a report easily using the crosstab wizard. However, the procedure you use with the wizard varies with the data resource type: business view or query resource. This topic introduces how you can create a crosstab using the crosstab wizard when you have different data resources. It also presents an example about creating a compound crosstab using a query resource in a page report.
This topic contains the following sections:
![]() A page report can apply either query resources or business views, which is determined by the Create Using Business View option at the time when you create the page report. Once defined, all data components in the page report can only use the specified data resource type.
A page report can apply either query resources or business views, which is determined by the Create Using Business View option at the time when you create the page report. Once defined, all data components in the page report can only use the specified data resource type.
Creating a Crosstab Based on a Business View
- Position the mouse pointer at the allowed report location where you want to insert the crosstab.
- Do one of the following:
- From the Components panel, drag the Crosstab icon
 in the Grid category to the report.
 - Navigate to Insert > Crosstab.
- Navigate to Home > Insert > Crosstab.
Designer displays the Create Crosstab dialog box. You can use the Back and Next buttons or select the screen name on the screen navigation bar to switch between the screens.
- From the Components panel, drag the Crosstab icon
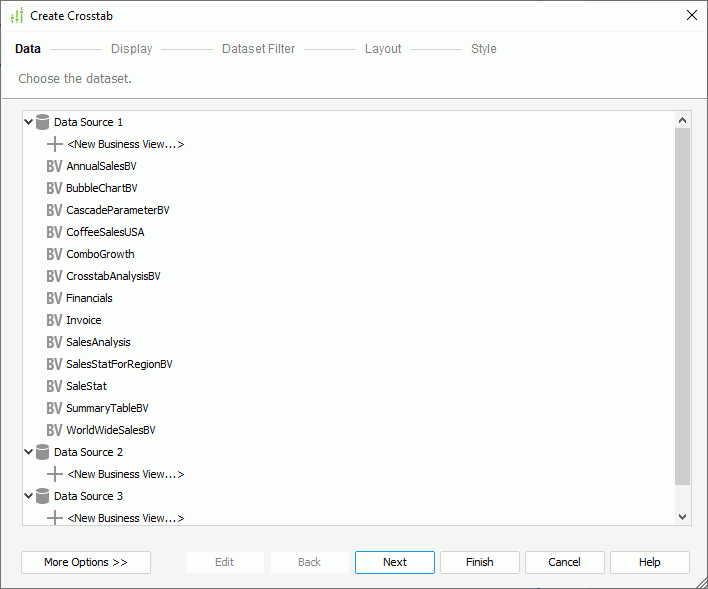
- In the Data screen, specify the dataset you want to use to create the
crosstab.
- In the Display screen, specify the fields to display in the crosstab. You can specify a title for the crosstab in the Title text box.
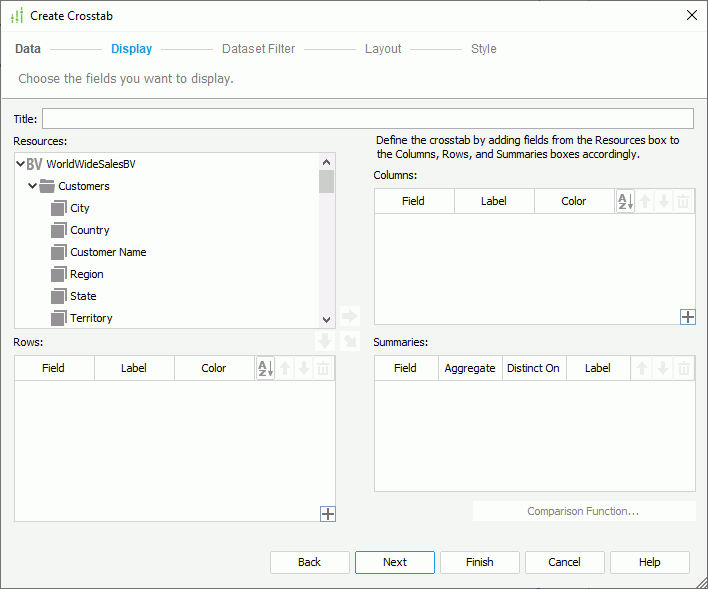
The Resources box lists all view elements in the business view from which the dataset the crosstab applies is created, and the dynamic formulas and aggregations that you have added for the business view in the current report. You can use these objects to create the crosstab.
- In the Columns and Rows boxes, add group objects
 or dynamic formulas used as Group
  as the column/row fields to display on the column and row headers of the crosstab. You can add an object using either the arrow button beside the target box or by dragging it from the Resources box to the target box.
For the column/row fields, you can specify the following:
- Double-click in the Label text box and type a name to label the corresponding column/row header (the Label text box is blank by default so the crosstab shows no label for the column/row header). When you select the Auto Map Field Name checkbox in the text box, Designer applies the field's display name as the label, and at runtime, Server maps the label to the dynamic display name of the field if the administrator defines it.
- Double-click in the Color text box to specify background color of the field. However, to make the color take effect, you need to edit the Background property of the field to "Transparent" in the Report Inspector after you finish creating the crosstab.
- Select a field and select Sort
 to change the sort manner of its values between Ascend, Descend, and No Sort.
 - Select a field and select Move Up
 or Move Down
  to adjust the display order of the field on the column/row header.
 - Select an unwanted field and select Remove
 or drag it to the Resources box to remove the field from the crosstab.
- In the Summaries box, add aggregation objects
 , detail objects
  , dynamic formulas used as Aggregation
  , dynamic formulas used as Detail
  , or dynamic aggregations
  as aggregate fields to create aggregations in the crosstab. You can add an object by either selecting Add
  or dragging it from the Resources box to the Summaries box.
For the aggregate fields, you can specify the following:
- When you add a detail object as the aggregate field, you need to double-click in its Aggregate text box to specify the aggregate function. If you select DistinctSum, you should select the ellipsis
 in the Distinct On text box to specify one or more fields according to whose unique values to calculate DistinctSum using the Select Fields dialog box.
 - Double-click in the Label text box and type a name to label the corresponding aggregations in the crosstab (the Label text box is blank by default so the crosstab shows no label for the aggregations). When you select the Auto Map Field Name checkbox in the text box, Designer applies the field's display name as the label, and at runtime, Server maps the label to the dynamic display name of the field if the administrator defines it.
- Select a field and select Comparison Function to define a comparison function for it.
- Select a field and select Move Up
 or Move Down
  to adjust the display order of the aggregate fields.
 - Select an unwanted field and select Remove
 or drag it to the Resources box to remove the field from the crosstab.
An aggregate field can generate detail aggregations, aggregations for subtotals, and aggregation for grand total.
- When you add a detail object as the aggregate field, you need to double-click in its Aggregate text box to specify the aggregate function. If you select DistinctSum, you should select the ellipsis
- In the Columns and Rows boxes, add group objects
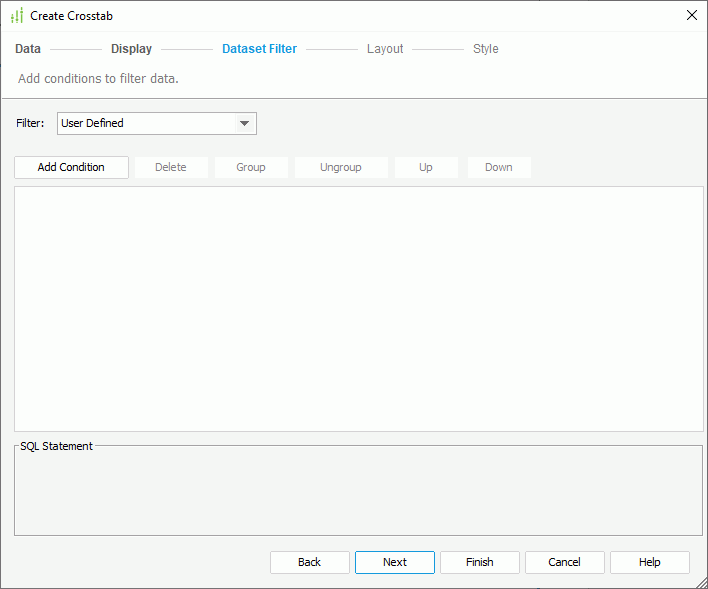
- In the Dataset Filter screen, filter the dataset the crosstab applies. If you have added filter conditions to the dataset somewhere else, Designer displays the conditions in the screen. You can further edit the conditions. Be aware that a filter on a dataset applies to all data components in the same report that use this dataset.
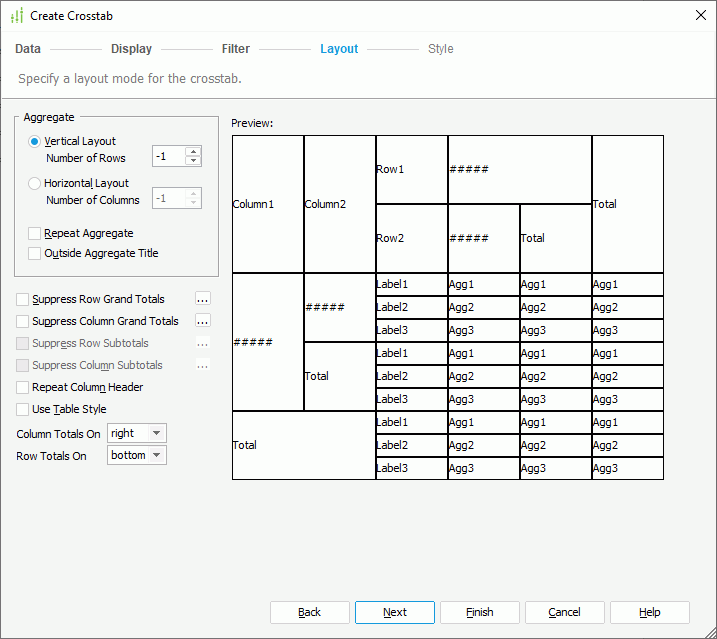
- In the Layout screen, specify the layout of the crosstab.
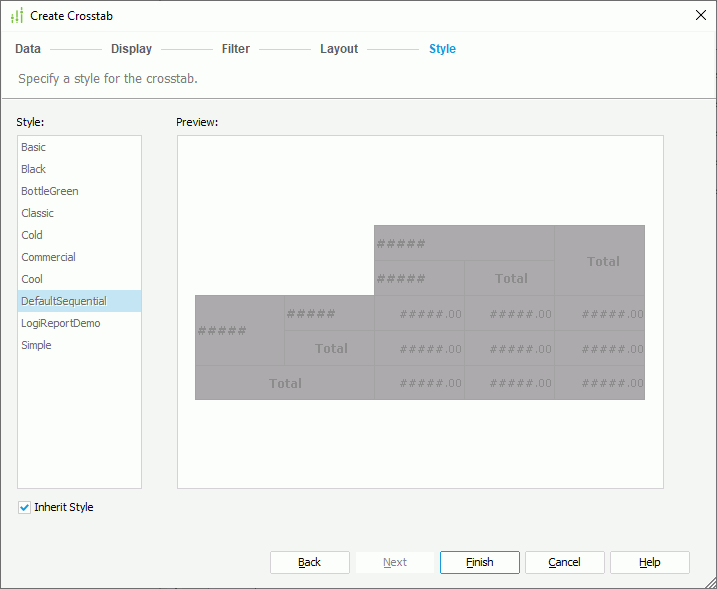
- In the Style screen, specify the style of the crosstab. If you have specified to insert the crosstab into a banded object, the crosstab inherits its parent's style by default; to apply another style to the crosstab, clear Inherit Style and select the required style from the Style box.
- Select Finish to insert the crosstab.
- If you have selected a panel in a banded object as the destination, after finishing the Create Crosstab dialog box, you need to select in the destination once again to insert the crosstab there.
Creating a Crosstab Based on a Query Resource
Using query resources, you can create compound crosstabs. A compound crosstab contains multiple crosstabs that are mashed up together in a flexible way. You can create aggregations based on any combinations of the row and column compound groups, making more complex analysis possible.
- Position the mouse pointer at the allowed report location where you want to insert the crosstab.
- Navigate to Insert > Crosstab or Home > Insert > Crosstab. Designer displays the Create Crosstab dialog box. You can use the Back and Next buttons or select the screen name on the screen navigation bar to switch between the screens.
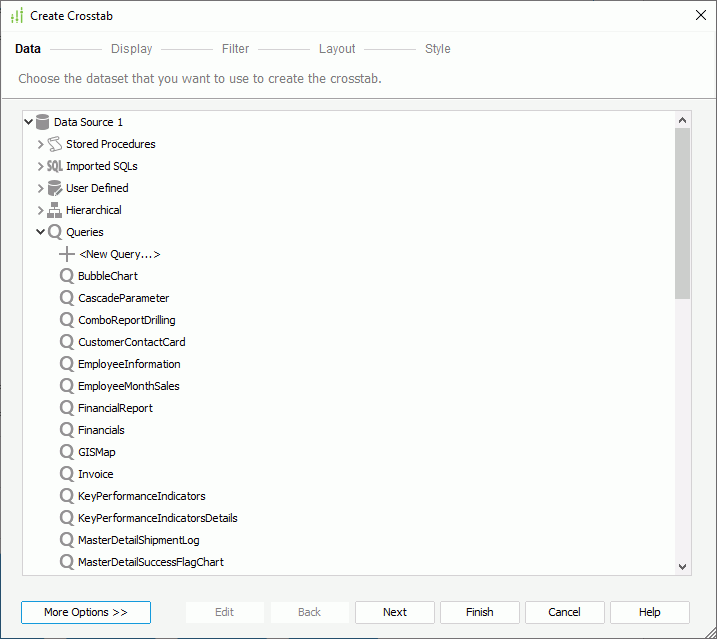
- In the Data screen, specify the dataset you want to use to create the
crosstab.
- In the Display screen, specify the fields to display in the crosstab.
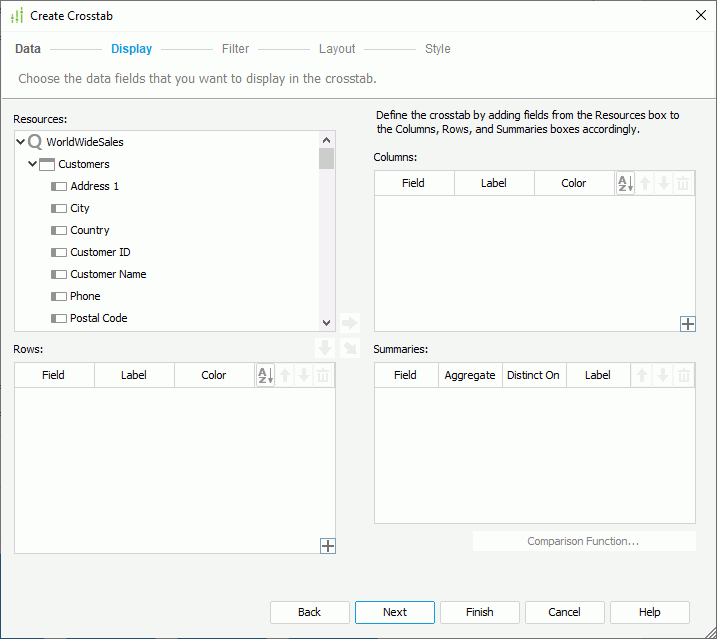
The Resources box lists all DBFields in the query resource from which the dataset the crosstab applies is created, and the formulas that are valid to these DBFields in the current catalog. You can create the crosstab using these fields. If the predefined formulas cannot meet your requirement, you can select <New Formula...> in the Formulas node to create the formulas you want.
- In the Columns and Rows boxes, add column/row fields to display on the column and row headers of the crosstab. To add a column/row field, select a DBField or formula in the Resources box and select the arrow button beside the target box, or drag it from the Resources box to the target box. If you want to display compound column/row groups in the crosstab, select Add Compound Group
 at the right bottom corner of the Columns/Rows box to create them, then select each compound group and add the required fields to it.
For the column/row fields, you can specify the following:
- Double-click in the Label text box and type a name to label the corresponding column/row header (the Label text box is blank by default so the crosstab shows no label for the column/row header).
- Double-click in the Color text box to specify background color of the field. However, to make the color take effect, you need to edit the Background property of the field to "Transparent" in the Report Inspector after you finish creating the crosstab.
- Select a field and select
 to change the sort manner of its values between Ascend, Descend, and No Sort.
 - Select a field and select Move Up
 or Move Down
  to adjust the display order of the column/row fields on the column/row headers. You can also adjust the display order of the compound groups in the same way.
 - Select an unwanted field and select Remove
 or drag it to the Resources box to remove the field from the crosstab. You can also delete any unwanted compound group in the same way.
- In the Summaries box, add aggregate fields to create aggregations in the crosstab. To add an aggregate field, select a DBField or formula in the Resources box and select Add
 or drag the field from the Resources box to the Summaries box. You can also select <New Crosstab Formula...> in the Crosstab Formulas node to create crosstab formulas to use as the aggregate field. If you have created compound column and row groups in the crosstab, you can add aggregate fields for each combination of the compound groups by selecting a row/column group and a column/row group and then adding the required fields. An aggregate field can generate detail aggregations, aggregations for subtotals, and aggregations for grand totals for each combination of the column and row fields.
 For the aggregate fields, you can specify the following:
- When you add a DBField or formula as the aggregate field, you need to double-click in the Aggregate text box to specify its aggregate function. If you select DistinctSum, you should select the ellipsis
 in the Distinct On text box to specify one or more fields according to whose unique values to calculate DistinctSum using the Select Fields dialog box.
 - Double-click in the Label text box and type a name to label the corresponding aggregations in the crosstab. The Label text box is blank by default so the crosstab shows no label for the aggregations.
- Select a field and select Comparison Function to define a comparison function for it.
- Select a field and select Move Up
 or Move Down
  to adjust the display order of the aggregate fields.
 - Select an unwanted field and select Remove
 or drag it to the Resources box to remove the field from the crosstab.
- When you add a DBField or formula as the aggregate field, you need to double-click in the Aggregate text box to specify its aggregate function. If you select DistinctSum, you should select the ellipsis
- In the Columns and Rows boxes, add column/row fields to display on the column and row headers of the crosstab. To add a column/row field, select a DBField or formula in the Resources box and select the arrow button beside the target box, or drag it from the Resources box to the target box. If you want to display compound column/row groups in the crosstab, select Add Compound Group
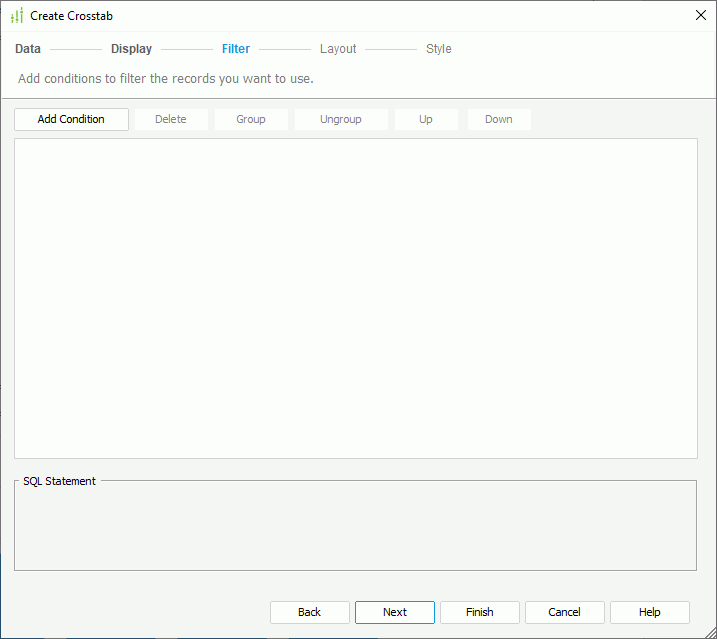
- In the Filter screen, filter the crosstab by adding conditions based on the fields it contains. Select here for how to define a filter.
- In the Layout screen, specify the layout of the crosstab.

- In the Style screen, specify the style of the crosstab. If you have specified to insert the crosstab into a banded object, the crosstab inherits its parent's style by default; to apply another style to the crosstab, clear Inherit Style and select the required style from the Style box.

- Select Finish to insert the crosstab.
- If you have selected a panel in a banded object as the destination, after finishing the Create Crosstab dialog box, you need to select in the destination once again to insert the crosstab there.
Besides using wizard, you can also drag a blank crosstab to a page report that uses query resources.
- From the Components panel, drag the Crosstab icon
 in the Grid category to the destination in the page report which allows the insertion of a crosstab. Designer creates a blank crosstab.
 - From the dataset drop-down list in the Data panel, select a dataset from the ones you have created in the page report to use for the crosstab, or select <Choose Data from...> to create a dataset and apply it to the crosstab. Designer then displays the data fields available to the specified dataset in the panel.
- Drag the required fields from the Data panel to create the column headers, row headers, and aggregations in the crosstab.
Example: Creating a Compound Crosstab
- Make sure SampleReports.cat is the currently open catalog file. If not, navigate to File > Open Catalog to open it from
<install_root>\Demo\Reports\SampleReports. - Navigate to File > New > Page Report.
- In the Select Component for Page Report dialog box, select Crosstab and select OK. Designer displays the Crosstab Wizard dialog box.
- In the Data screen, select the query WorldWideSales in Data Source 1 of the catalog.
- In the Display screen, select Add Compound Group
 in the Rows box and Designer adds two compound row groups in the box.
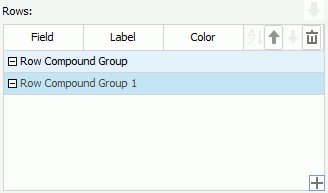
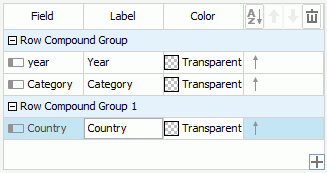
- Select Row Compound Group, drag the formula year and the field Category from the Resources box to the compound row group one by one, double-click in the Label text box of each field and type Year and Category to label the row headers.
- Select Row Compound Group 1 and add the field Country to it and edit its label to Country.
- Select Add Compound Group
 in the Columns box, then add the formula Quarter to Column Compound Group and the field Order ID to Column Compound Group 1, specify their labels as Quarter and Order ID.
 - Select Row Compound Group in the Rows box and Column Compound Group in the Columns box, drag the field Quantity from the Resources box to the Summaries box as the aggregate field of the compound groups. Double-click in the Aggregate text box and select Sum from the drop-down list, then double-click in the Label text box and type Quantity to label the aggregations.
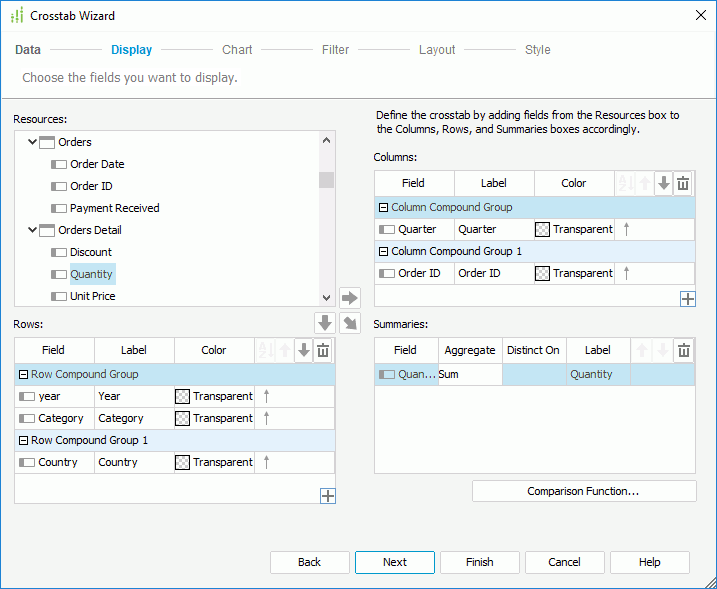
- Repeat the preceding step to add the following fields with the specified aggregate functions as the aggregate fields for the combinations of the following compound groups. Use the fields' display names as the labels.
- Row Compound Group and Column Compound Group 1: Price, Average
- Row Compound Group 1 and Column Compound Group: Cost, Sum
- Row Compound Group 1 and Column Compound Group 1: Unit Price, Average
- Switch to the Filter screen and specify the filter conditions.
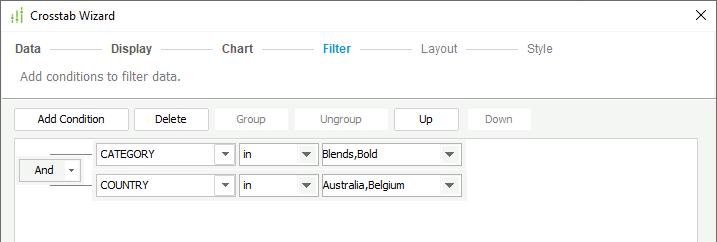
- Select Finish to create the crosstab.
- In the Report Inspector, select Label, Label 1, QUARTER, Label 4, Label 5, YEAR, Label 6, Label 7, CATEGORY, Label 10, Label 11, Label 12, QUANTITY, QUANTITY 1, QUANTITY 2, QUANTITY 3, QUANTITY 4, and QUANTITY 5, specify the Background property to Lightgray.
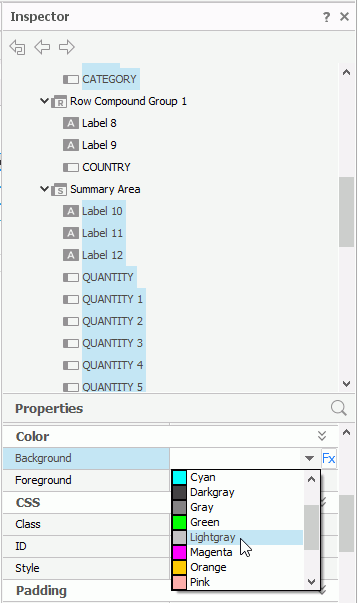
- Repeat the preceding step to specify the Background property of Label 2, Label 3, Order ID, Label 15, Label 16, Label 17, PRICE, PRICE 1, PRICE 2, PRICE 3, PRICE 4, and PRICE 5 to Pink; specify the Background property of Label 8, Label 9, COUNTRY, Label 13, Label 14, COST, COST 1, COST 2, and COST 3 to Orange; specify the Background property of Label 18, Label 19, UNIT PRICE, UNIT PRICE 1, UNIT PRICE 2, and UNIT PRICE 3 to Gray.
- Save the report.
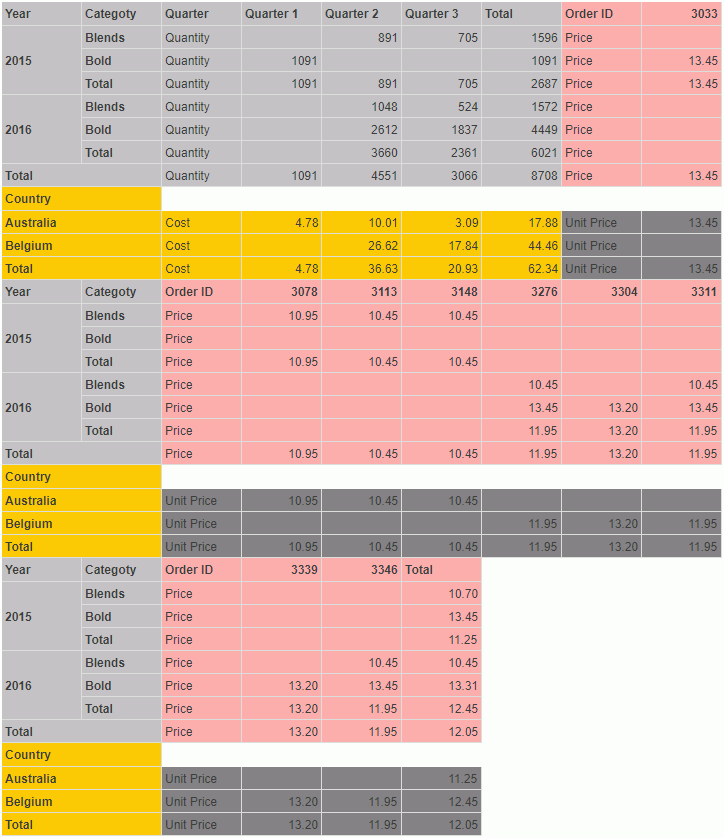
- Navigate to View > Preview As > Page Report Result to run the report in Page Report Studio. The crosstab contains four parts, showing different summary information for different combinations of row compound groups and column compound groups.
 Previous Topic
 Back to top