Advanced Dialog Box
You can use the Advanced dialog box to achieve different goals. This topic describes the options in the dialog box, which vary according to the different sources where you open it.
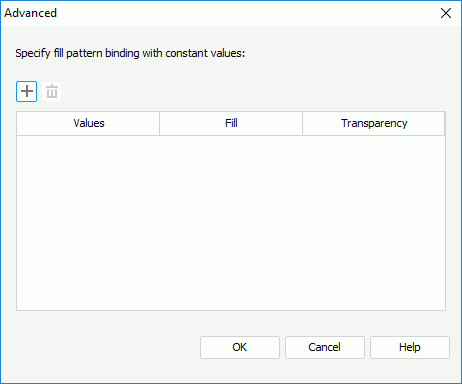
When you open the Advanced dialog box from the Color List dialog box, you can use it to define certain patterns to specific values in a chart to apply the same visual effect to the same value. Note that this feature does not apply to surface 3-D, gauge bubble 2-D, and all scatter chart types, and the settings in the dialog box have higher priority than the ones in the Color List dialog box.

Designer displays these options:
 Add button
Select to add a new value line.
 Remove button
Select to delete the specified value.
Values
This column shows the values to which you select to apply the fill patterns.
- When the chart has series field, specify a series value to which to apply the fill pattern.
- When the chart has no series field, specify a category value to which to apply the fill pattern.
Fill
This column shows the fill patterns that you specify to apply to the values. To edit the fill pattern, select the color indicator and specify a color or effect using the color palette. You can also type the hexadecimal RGB value of a color (for example, 0xff0000) in the text box.
Transparency
This column shows the transparency for the fill patterns that you specify to apply to the values.
OK
Select to apply your settings and close the dialog box.
Cancel
Select to close the dialog box without saving any changes.
Help
Select to view information about the dialog box.
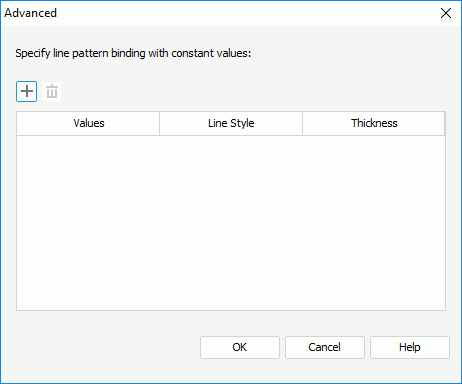
When you open the Advanced dialog box from the Line Pattern List dialog box, you can use it to define certain pattern to specific values in a line chart to apply the same visual effect to the same value.
![]() The settings in the Advanced dialog box have higher priority than the ones in the Line Pattern List dialog box.
The settings in the Advanced dialog box have higher priority than the ones in the Line Pattern List dialog box.

Designer displays these options:
 Add button
Select to add a new value line.
 Remove button
Select to delete the specified value.
Values
This column shows the series values to which you specify to apply the line patterns.
Line Style
This column shows the style of the lines that you specify to apply to the values.
Thickness
This column shows the thickness for the lines that you specify to apply to the values.
OK
Select to apply your settings and close the dialog box.
Cancel
Select to close the dialog box without saving any changes.
Help
Select to view information about the dialog box.
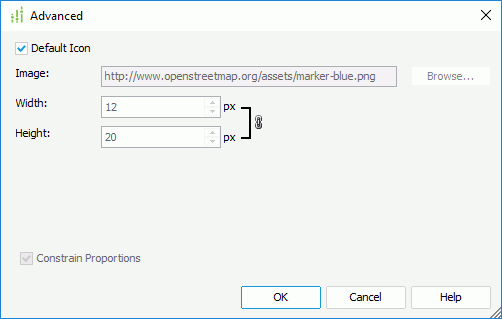
When you open the Advanced dialog box from the Display screen of the map wizard, you can use it to specify an image as the shape of the markers for the selected group in a geographic map.

Designer displays these options:
Default Icon
Select to use the default icon as the shape of the markers. Clear this option if you want to use your own icon.
Image
Specify the image to use as the shape of the markers. You can type the URL for a web image or select Browse to specify a local image.
- Width
Specify the width of the image. - Height
Specify the height of the image.
Shadow
Designer displays this option only for the Google Maps types. Type the URL for a web image or select Browse to specify a local image to use as the shadow image of the markers.
- Width
Specify the width of the shadow image. - Height
Specify the height of the shadow image.
Constrain Proportions
If you select this option, when you set the width or height of the image, Designer adjusts the other accordingly in a certain proportion.
OK
Select to apply your settings and close the dialog box.
Cancel
Select to close the dialog box without saving any changes.
Help
Select to view information about the dialog box.
 Previous Topic
 Back to top