Format Rectangle Dialog Box
You can use the Format Rectangle dialog box to format the rectangles of the specified group in a heat map. This topic describes the options in the dialog box.
Designer displays the Format Rectangle dialog box when you do either of the following:
- When there is only one group in the heat map, right-click the heat map and select Format Rectangle from the shortcut menu.
- When there are two or more groups in the heat map, right-click the heat map and select a group field from the Format Rectangle submenu.
The dialog box contains the following tabs (Designer displays the Behaviors tab only when the chart is in a library component):
Designer displays these buttons in all the tabs:
OK
Select to apply your settings and close the dialog box.
Cancel
Select to close the dialog box without saving any changes.
Apply
Select to apply all changes and leave the dialog box open.
Help
Select to view information about the dialog box.
Fill Tab
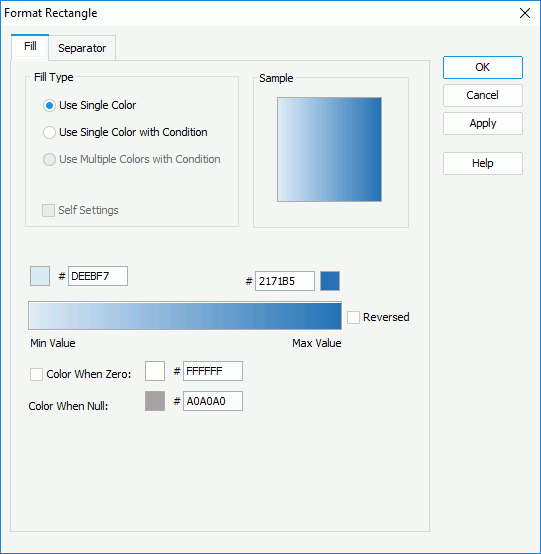
Use this tab to specify the fill pattern of the rectangles in the heat map.

Use Single Color
Select to apply single color pattern to fill the rectangles. Designer displays different options for setting the color pattern according to how the heat map is colored by.
- Designer displays these options if the heat map is colored by a summary:
- Start color
Specify the starting color of the gradient, which Designer maps to the minimum value of the summary. To edit the color, select the color indicator and select a color from the color palette, or type the hexadecimal RGB value of a color (for example, 0xff0000) in the text box. - End color
Specify the ending color of the gradient, which Designer maps to the maximum value of the summary. - Reversed
Select to reverse the starting color and ending color of the gradient. - Color When Zero
Select to map the zero value to the specified color. When this option is cleared by default, the gradient changes from the starting color to the ending color. When you select it, the gradient changes from the starting color to the zero value color, and then from the zero value color to the ending color. - Color When Null
Specify the color for the null value.
- Start color
- Designer displays these options if the heat map is colored by one of the following cases: no field, 1 to n groups, 1 to n groups and 1 summary:
- Color
Specify the color of the rectangles. To edit the color, select the color indicator and select a color from the color palette, or type the hexadecimal RGB value of a color (for example, 0xff0000) in the text box. - Transparency
Specify the transparency of the color. - Self Settings
Select to apply the color pattern to the rectangles themselves only. When this option is cleared, Designer synchronizes the color pattern that you specify here with the Pattern List property of the chart in the Report Inspector, which data markers of other subtypes can also apply if the chart is a combo chart.t. - Vary Colors by Color List
Select to apply different colors to the rectangles. - Color List
Select to open the Color List dialog box to modify the color pattern for each rectangle.
- Color
Use Single Color with Condition
Select to make each rectangle apply its own single color pattern based on the defined conditions. You can select Advanced or Normal to switch between the two editing modes to edit the conditions.
- Normal
- Select Field
This drop-down list contains all the available fields to which you can apply the conditional fill. Select the field on which you want to define the conditions. -
 Add button
Select to add a new condition. -
 Remove button
Select to delete the specified user-defined condition. - Value
Designer displays the column when you select a group-by field of the chart, or a field the values of which are not numbers from the Select Field drop-down list. It shows the values that you specify for each condition. - Start Value
Designer displays the column when you select a value field of the chart, or a field containing numeric values from the Select Field drop-down list. It shows the start values that you specify for each condition. - End Value
Designer displays the column when you select a value field of the chart, or a field containing numeric values from the Select Field drop-down list. It shows the end values that you specify for each condition. - Color
This column shows the colors you specify to apply to values that meet the conditions. To edit the color, select the color indicator and select a color from the color palette, or type the hexadecimal RGB value of a color (for example, 0xff0000) in the text box. - Transparency
This column shows the transparency of the colors you specify for the conditions. - Label
Select to modify the legend entry label for values of the specified condition. - Value
Designer displays this option after you select a value field of the chart, or a field containing numeric values from the Select Field drop-down list. Select it if you want to display data in the condition expression as value. - Percent
Designer does not support this option when you edit conditions for a heat map.
- Select Field
- Advanced
-
 Edit button
Select to open the Edit Conditions dialog box to create or edit a condition. - Condition
This column shows the default condition Other and the expression of the condition you add. - Color
This column shows the colors you specify to apply to values that meet the conditions. To edit the color of the default Other condition, select the color indicator and select a color from the color palette, or type the hexadecimal RGB value of a color (for example, 0xff0000) in the text box. - Transparency
This column shows the transparency of the colors you specify for the conditions. To edit the transparency of the default Other condition, select in the text box and specify the transparency. - Label
Select to modify the legend entry label for values of the specified condition.
-
Sample
This box displays a preview sample based on your selections.
Separator Tab
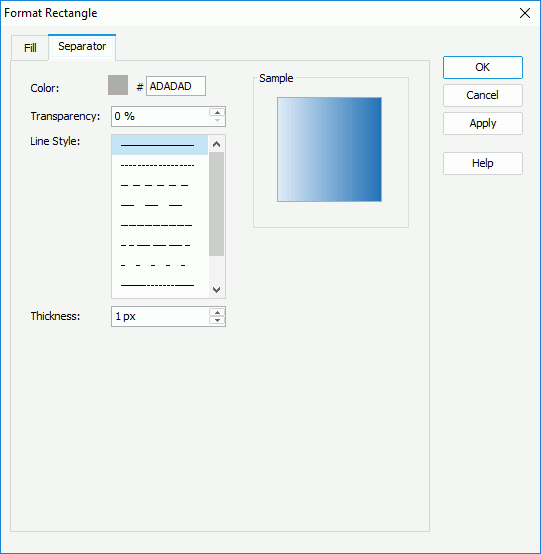
Use this tab to specify line properties of the separator that divides the rectangles in the heat map.

Color
Specify the color of the separator. To edit the color, select the color indicator and select a color from the color palette, or type the hexadecimal RGB value of a color (for example, 0xff0000) in the text box.
Transparency
Specify the transparency of the separator.
Line Style
Select the line style of the separator.
Thickness
Specify the width of the separator.
Sample
This box displays a preview sample based on your selections.
Behaviors Tab
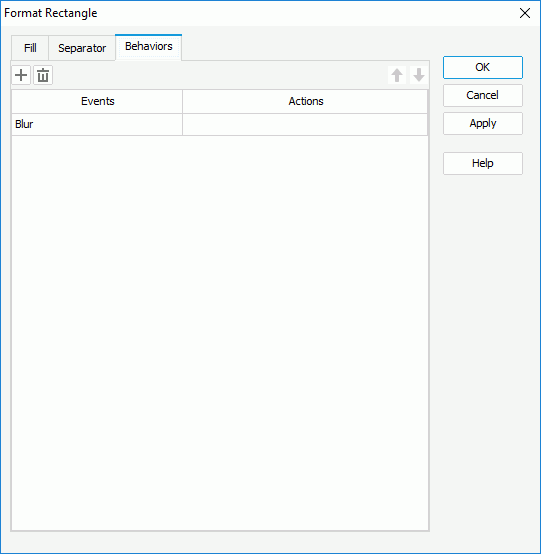
Designer displays the Behaviors tab only when the heat map is in a library component. You can use it to specify web behaviors to the rectangles of the heat map.

 Add button
Select to add a new web behavior line.
 Remove button
Select to delete the specified web behavior.
 Move Up button
Select to move the specified web behavior higher in the list. At runtime, when an event bound with more than one action happens, JDashboard triggers the upper action first.
 Move Down button
Select to move the specified web behavior lower in the list.
Events
This column shows the events that you select to trigger the web actions.
Actions
This column shows the web actions that you specify for the events to trigger. Select the ellipsis  in each cell to bind the web action using the Web Action List dialog box.
 Previous Topic
 Back to top