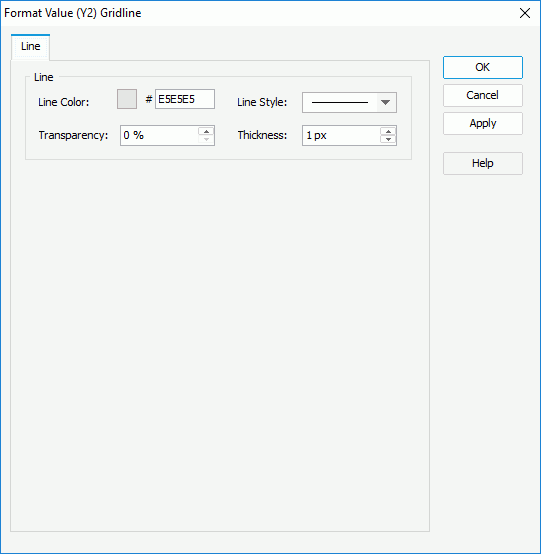
Format Value (Y2) Gridline Dialog Box
You can use the Format Value (Y2) Gridline dialog box to format the gridlines on the secondary value axis (the Y2 axis) of a combo chart. This topic describes the options in the dialog box.
Designer displays the Format Value (Y2) Gridline dialog box when you right-click a chart and navigate to Format Gridlines > Value (Y2) Gridline on the shortcut menu, or double-click any gridline on the secondary value axis of a combo chart.

Designer displays these options:
Line Color
Specify the color of the gridlines. To edit the color, select the color indicator and select a color from the color palette, or type the hexadecimal RGB value of a color (for example, 0xff0000) in the text box.
Line Style
Specify the line style of the gridlines.
Transparency
Specify the transparency of the gridlines.
Thickness
Specify the thickness of the gridlines, in pixels.
OK
Select to apply your settings and close the dialog box.
Cancel
Select to close the dialog box without saving any changes.
Apply
Select to apply all changes and leave the dialog box open.
Help
Select to view information about the dialog box.
 Previous Topic
 Back to top