Scrollable Chart Dialog Box
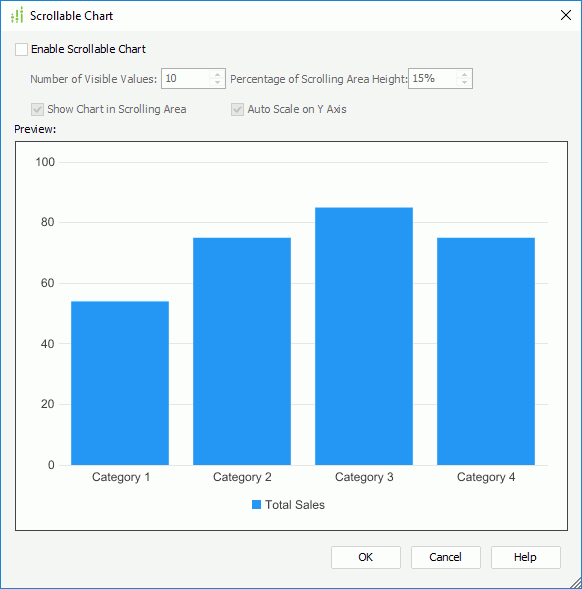
You can use the Scrollable Chart dialog box to specify whether to make a chart scrollable. This topic describes the options in the dialog box.
Designer displays the Scrollable Chart dialog box when you right-click any element of a 2-D chart of the Bar, Bench, Line, or Area type except the chart object in a web report or library component and select Scrollable Chart from the shortcut menu.

Designer displays these options:
Enable Scrollable Chart
Select to add a scroll bar in the chart, using which you can control the number of the visible values on the category axis.
- Number of Visible Values
Specify how many data items to be selected on the scroll bar and display on the category axis by default. - Percentage of Scrolling Area Height
Specify the percentage the scroll bar occupies the whole size of the chart. - Show Chart in Scrolling Area
Select to show the thumbnail chart on the scroll bar. - Auto Scale on Y Axis
Select to recalculate the scale of the value (Y) axis in the chart when the number of the visible values changes on the category axis.
Preview
This box displays the effect of your settings on the chart.
OK
Select to apply your settings and close the dialog box.
Cancel
Select to close the dialog box without saving any changes.
Help
Select to view information about the dialog box.
 Previous Topic
 Back to top