Customize Profile Dialog Box Properties
This topic describes how you can use the Customize Profile dialog box to customize your Server profile.
Server displays the dialog box when you navigate to the Server Console > My Profile > Customize Profile page and then select Customize Profile.
By default, Server clears Enable Customize Properties for users on a new Server and new users. Select Enable Customize Properties if you want to customize the Server profile. Then, Server displays the following four tabs: Common, Page Report Studio, Web Report Studio, and JDashboard.
This topic contains the following sections:
- Common Tab Properties
- Page Report Studio Tab Properties
- Web Report Studio Tab Properties
- JDashboard Tab Properties
You see these elements on all the tabs:
OK
Select to apply any changes you made here and exit the dialog box.
Cancel
Select to close the dialog box without saving any changes.
Restore Defaults
Select to reset to the default settings.
Reset
Select to reset to the settings you saved last time.
Help
Select to view information about the dialog box.
Common Tab Properties
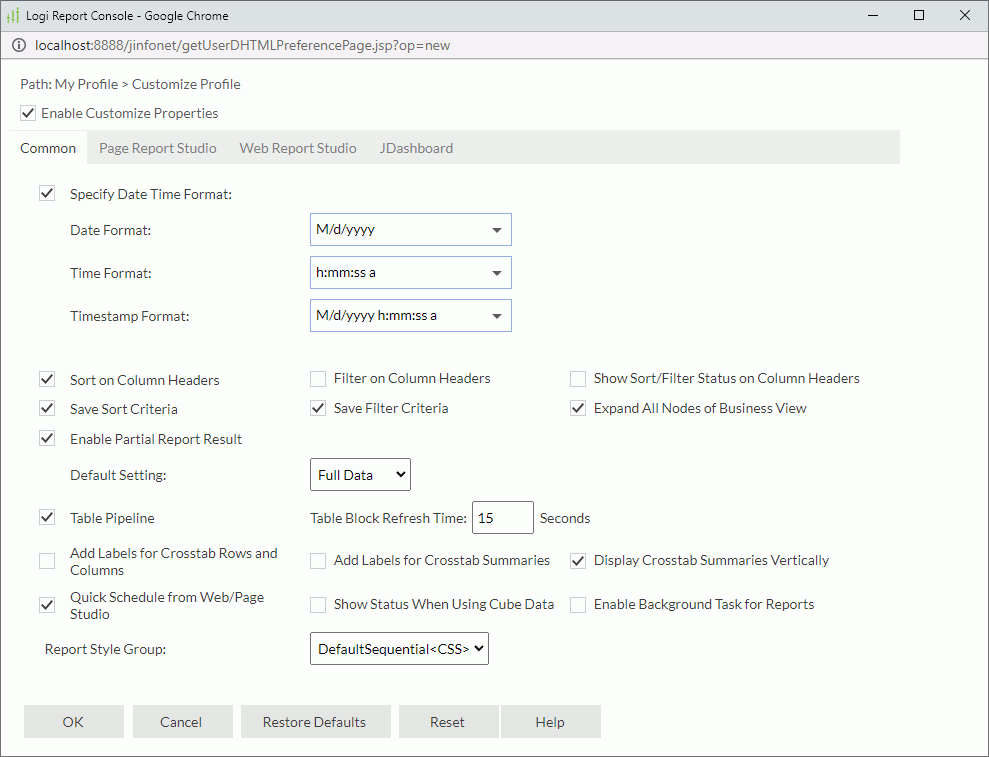
Specify the common properties for Page Report Studio, Web Report Studio, and JDashboard.

Specify Date Time Format
Select the default Date, Time, and Timestamp formats in which you want to display date and time in Page Report Studio, Web Report Studio, and JDashboard, for example, the last modified time or print time of a report, and the date values in the dataset filter value list.
- Date Format
Select the default format for the date values. - Time Format
Select the default format for the time values. - Timestamp Format
Select the default format for the timestamp values.
You can sort data in tables by selecting the sort buttons on table column headers in Web Report Studio and JDashboard.
Filter on Column Headers
Select if you want to filter data in tables by selecting the filter buttons on table column headers in Web Report Studio and JDashboard.
Show Sort/Filter Status on Column Headers
Select if you want to display the sort/filter button with the current sort/filter status on the table column headers after you apply sort/filter conditions to the columns.
Save Sort Criteria
Server selects the Save Sort Criteria option by default in the save dialog box when saving a report/dashboard to a report/dashboard version or as a new report/dashboard, and saves the sort defined in a report/dashboard by default when saving the report/dashboard.
Save Filter Criteria
Server selects Save Filter Criteria by default in the save dialog box when saving a report/dashboard to a report/dashboard version or as a new report/dashboard, and saves the filter defined in a report/dashboard by default when saving the report/dashboard.
Expand All Nodes of Business View
Server expands the nodes of business view resource trees in Web Report Studio by default. It is best suited for business views containing a few folders and data fields. Clear this option if you have many resources to view, and if you would like all folders to collapse by default in the resource tree.
After you expand or collapse nodes in a resource tree, Web Report Studio remembers the changes and applies them anywhere you view the resource tree, within the report session.
Select the option and then select Partial Data from the Default Setting drop-down list, if you want to retrieve partial data only when running reports in Page Report Studio and Web Report Studio. You can further specify the default number of records you want to retrieve. By default, Server retrieves the first 5000 records. Server displays a report data mode drop-down list on the toolbar of Page Report Studio and Web Report Studio, with which you can switch to show full report data. When a report contains a large amount of data, it is helpful to retrieve only a specific number of records for performance concern.
Table Pipeline
Server enables table pipeline to speed up the rendering performance of tables involving millions of data records in Web Report Studio and JDashboard.
- Table Block Refresh Time
The time interval in seconds for refreshing the table data to update partial data before the tables are fully ready.
Add Labels for Crosstab Rows and Columns
Select if you want Server to automatically provide the labels or display names for the group objects you add as rows and columns, in the crosstab wizard in Page Report Studio and Web Report Studio.
Add Labels for Crosstab Summaries
Select if you want Server to automatically provide the labels or display names for the aggregation objects you add as summaries, in the crosstab wizard in Page Report Studio and Web Report Studio.
Display Crosstab Summaries Vertically
Server displays summaries vertically in crosstabs in Page Report Studio and Web Report Studio.
Quick Schedule from Web/Page Studio
You can schedule report tasks in the View Mode of Web Report Studio and in the Basic View of Page Report Studio.
Show Status When Using Cube Data
Select if you want to view information about whether a data component applies an in-memory cube and the reason if not, in Web Report Studio and JDashboard.
Enable Background Task for Reports
Select if you want to run reports in the background and keep open reports as background tasks.
Report Style Group
Select the default style for the four types of components when creating them via the report wizard in Web/Page Report Studio: table, crosstab, chart, and banded object. However, when you insert them into a table or banded object which can bind style, the default style will be Inherit Style instead of the style you specified here.
All CSS styles in the <install_root>\style directory are available in the list for your selection.
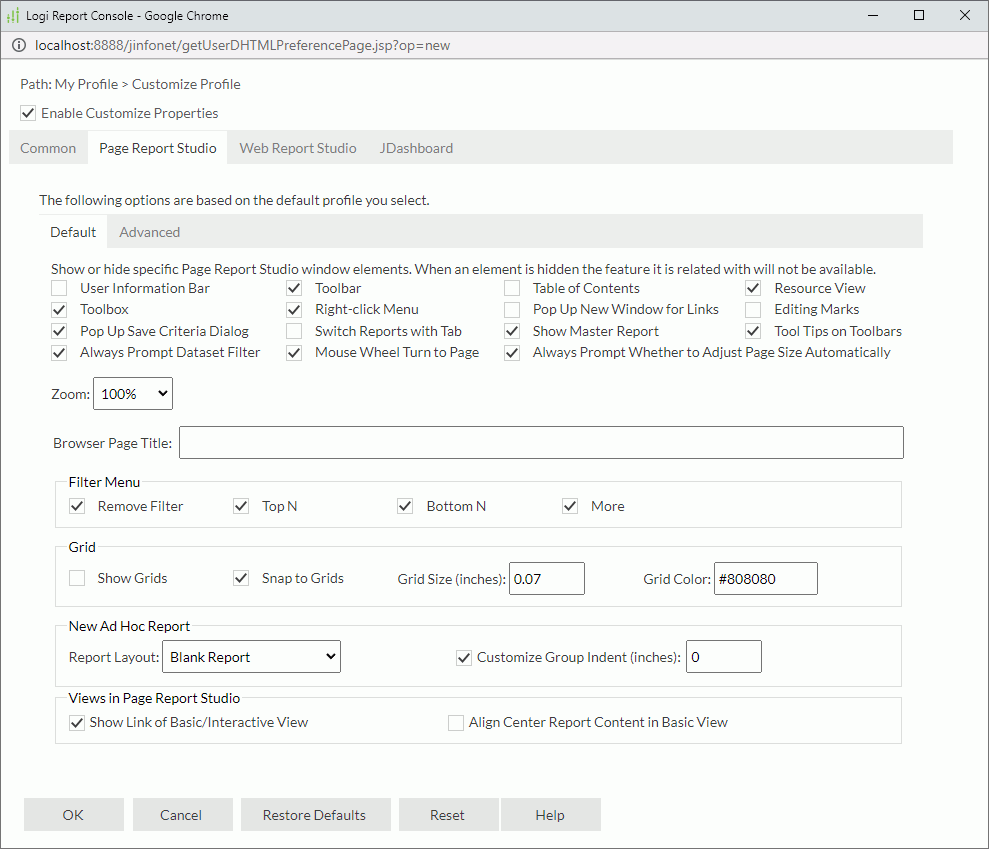
Page Report Studio Tab Properties
Customize the Default and Advanced properties you want to use in Page Report Studio.

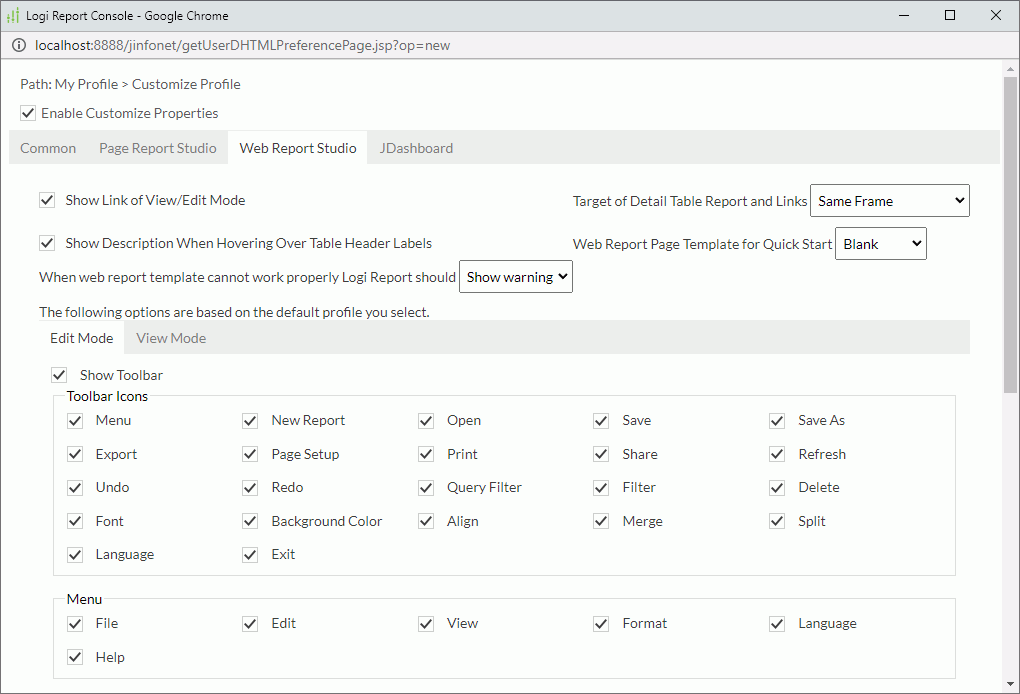
Web Report Studio Tab Properties
Customize the preferences and features of Web Report Studio. For more information, see Properties.

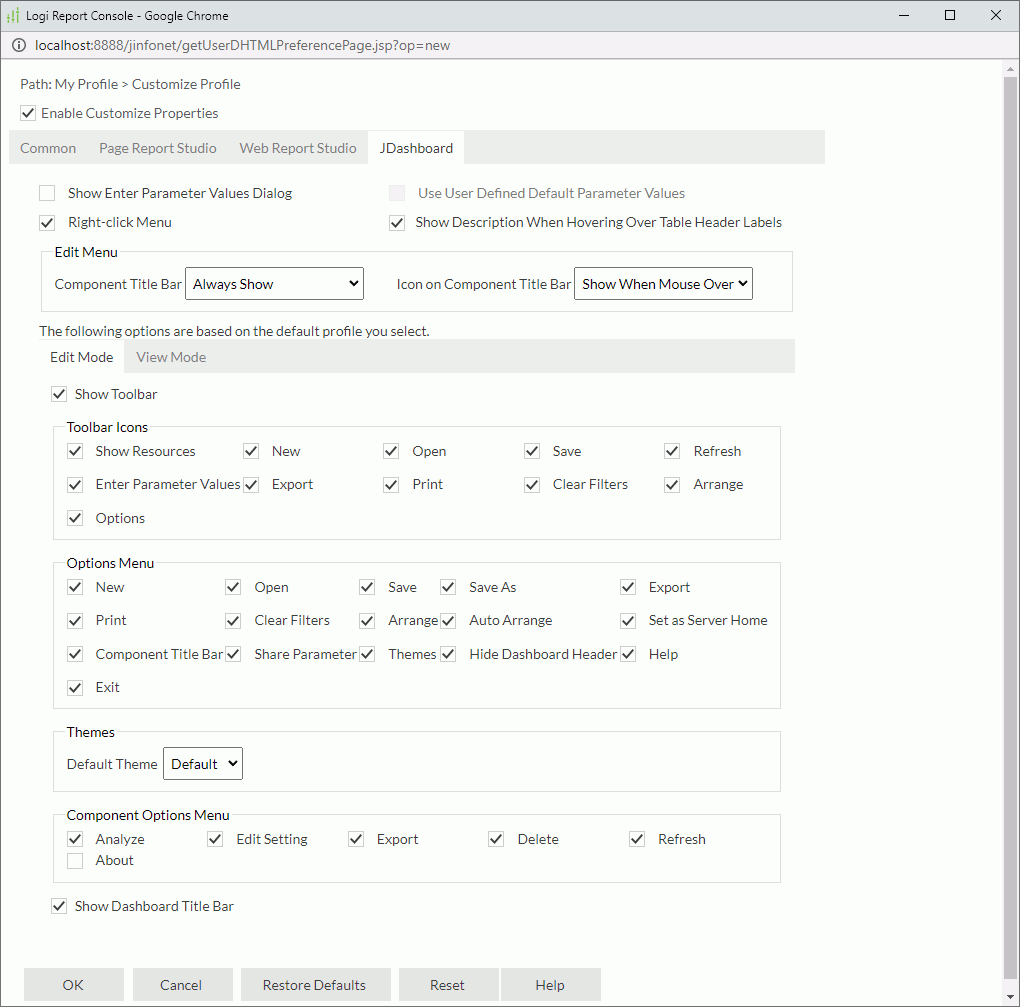
JDashboard Tab Properties
Customize the preferences and features of JDashboard. The tab is available when you have the JDashboard license. For more information, see Properties.

 Previous Topic
 Back to top