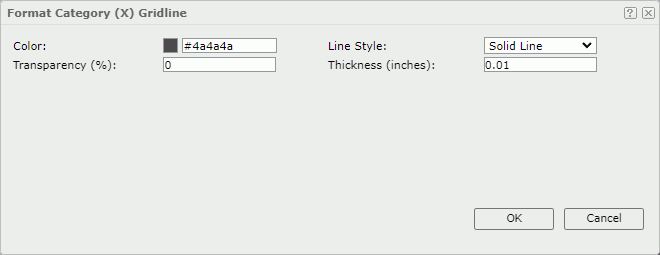
Format Category (X) Gridline Dialog Box Properties
This topic describes how you can use the Format Category (X) Gridline dialog box to format the gridlines on the category (X) axis of a chart.
Server displays the dialog box when you right-click a chart and then select Format Gridlines (unavailable to pie, indicator, heat map, and org charts) > Format Category (X) Gridline from the shortcut menu.

Color
Specify the color schema of the gridlines.
Transparency
Specify the transparency of the color that you want to apply to the gridlines.
Line Style
Specify the line style of value gridlines.
Thickness
Specify the thickness of value gridlines.
OK
Select to apply any changes you made here and close the dialog box.
Cancel
Select to close the dialog box without saving any changes.
 Help button
Select to view information about the dialog box.
 Close button
Select to close the dialog box without saving any changes.
 Previous Topic
 Back to top