Monitoring the Server Performance
This topic describes how you can monitor the server performance in two ways: using Report Server Monitor or using an external method - JMX MBean API.
This topic contains the following sections:
- Monitoring the Server Performance on Server Monitor
- Monitoring the Server Performance Using JMX MBean API
Monitoring the Server Performance on Server Monitor
Server Monitor can show performance counters in graph (Line chart and Bar chart) and text mode.
To monitor the performance of Server on Server Monitor:
- In the left panel of the Server Monitor home page, select any server node.
- Select the Performance tab. Monitor displays the performance chart of the server.
- If you want to configure the performance chart, select the Graph Options button
 on the toolbar. Monitor displays the Graph Options dialog box.
 - Type the number of tick marks you want to display on the X axis in the Keep Last N Records text box.
- In the Y Axis Limit text box, type the maximum value on the left Y axis.
- In the Y2 Axis Limit text box, type the maximum value on the right Y axis.
- In the Interval text box, type the time interval in seconds the performance chart will use to get data and refresh itself.
- Select OK to apply your changes.
- Select the Clear Display button
 if you want to clear the current display of the performance counters in the performance chart.
 - To stop the current display of the performance counters, select the Stop button
 on the toolbar.
See the following information about the available counters:
| Performance Counter | Description |
|---|---|
| Waiting Reports | The number of the currently waiting reports. |
| Running Reports | The number of the currently running reports. |
| Finished Reports | The number of the finished reports. |
| Finished Report Pages | The number of pages of the finished reports. |
| Average Submitted Tasks per User | The average number of tasks that each user has submitted since Server started. |
| Valid User Sessions | The number of valid user sessions. |
| Database Connections | The number of database connections. |
| Report Average Waiting Time | The average waiting time of each report. |
| Report Average Processing Time | The average processing time of each report. |
Monitoring the Server Performance Using JMX MBean API
- Make your application environment consistent with the JMX specification.
- In server.properties, set both properties server.rmiserver.enable and server.profiling.enable to true.
- Run your code. See the following example:
ObjectName profilingName = new ObjectName("jinfonet:name=profileCounter");
ProfilingFactory ft = new ProfilingFactory("127.0.0.1",1129, "d:\\monitor");
ProfilingCounter profilingCounter = new ProfilingCounter(ft);
MBeanServer server = MBeanServerFactory.createMBeanServer();
server.registerMBean(profilingCounter, profilingName);
ProfileNotifyListener notifyListener = new ProfileNotifyListener();
profilingCounter.addNotificationListener(notifyListener, null,null);
// Create an RMI connector and start it
JMXServiceURL url = new JMXServiceURL("service:jmx:rmi:///jndi/rmi://localhost:9999/server");
JMXConnectorServer cs = JMXConnectorServerFactory.newJMXConnectorServer(url, null, server);
cs.start();
In code part
ProfilingFactory ft = new ProfilingFactory("127.0.0.1",1129, "d:\\monitor"), the parameters serverHost and serverRMIPort get server's ProfilingService remote object, and the parameter homepath is the path of the rmi.auth file for RMI authority checking public ProfilingFactory(String serverHost, int serverRMIPort, String homepath). - Check the monitoring result.
See the available counters that you can use in JMX MBean API:
| Performance Counter | Counter Name | Counter Type | Description |
|---|---|---|---|
| Total Completed Tasks | TotalCompletedTasks | int | The total tasks that completed. |
| Number of Reports per Minute | NumberofReportsPerMinute | float | The number of the reports running per minute. |
| Total Number of Pages Exported | TotalNumberofPageExported | long | The total number of the exported report pages. |
| Exported Pages per Minute | ExportPagesPerMinute | float | The number of exported report pages per minute. |
| Successful Tasks | SuccessfulTasks | int | The tasks that have run successfully. |
| On-demand Tasks | OnDemandTasks | int | The tasks that have run on-demand. |
| Average Number of Pages | TaskAveragePages | float | The average number of report pages for each task. |
| Maximum Number of Pages | TaskMaximumPages | long | The maximum number of report pages for all tasks. |
| Average Running Time per Task | TaskAverageRunTime | float | The average running time of each task. |
| Maximum Running Time | TaskMaximumRunTime | float | The maximum running time of the tasks. |
| Average Waiting Time per Task | TaskAverageWaitTime | float | The average waiting time of each task. |
| Maximum Waiting Time | TaskMaxWaitTime | float | The maximum waiting time of the tasks. |
| Average Engine Time per Task | TaskAverageEngineTime | float | The average running time of each task on engine. |
| Maximum Engine Time | TimeTaskMaximumEngine | float | The maximum running time of all tasks on engine. |
| Average Concurrent Engines | AverageConcurrentEngines | float | The average number of concurrent engines for each task. |
| Maximum Concurrent | MaximumConcurrent | long | The maximum number of concurrent engines for all tasks. |
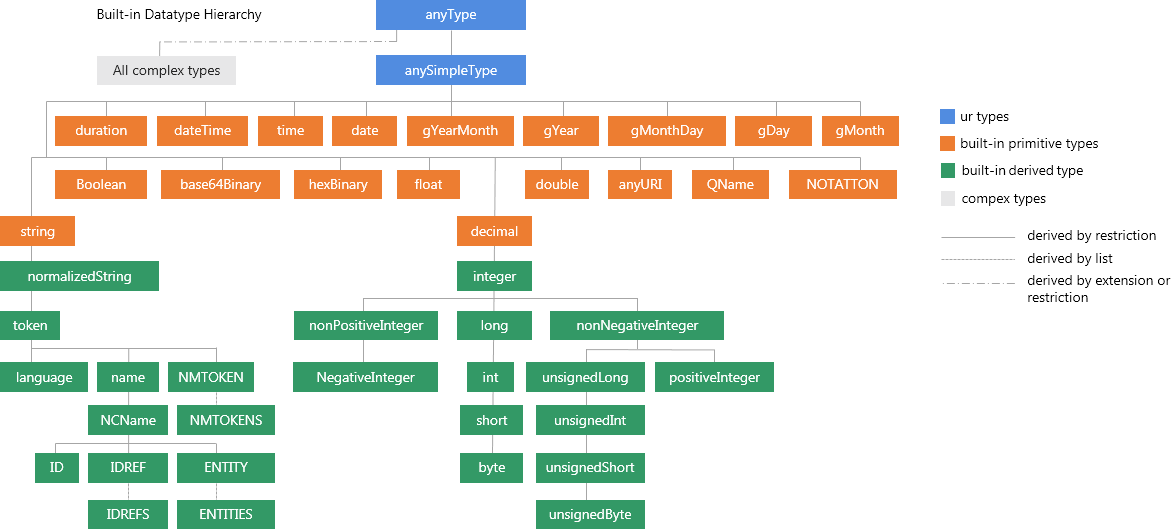
In JMX MBean API, the data type of the profiling counters must be Decimal. See a figure of built-in data type hierarchy that you can refer for the return value:

 Previous Topic
 Back to top