Making Simple Modifications to Web Report Components
This topic describes the general actions that you can perform on the web report components: move, resize, show, hide, edit, and remove a component, and more.
This topic contains the following sections:
- Moving a Component
- Resizing a Component and Its Elements
- Hiding/Showing a Component
- Editing a Component
- Modifying Component Properties
- Changing the Position Property of Components
- Removing a Component
Moving a Component
When the Position property of a component is absolute, you can move it to another place in the current container freely. To move a component, hover over the component, when Server displays the icon  at the upper right, drag the icon to the destination.
Resizing a Component and Its Elements
To resize a component, select anywhere in the component. A rectangle surrounds it with resizing handles. Hover over a handle. When the mouse pointer changes to a double-headed arrow, drag the handle to resize the component. When the width or height of a component is fully displayed, you cannot further enlarge the right or bottom boundary.
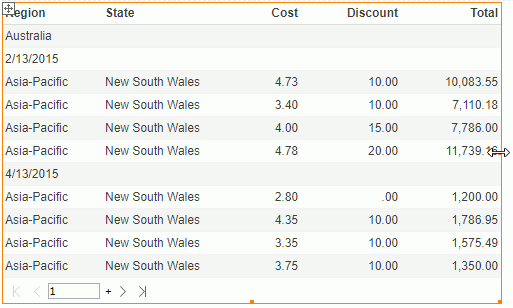
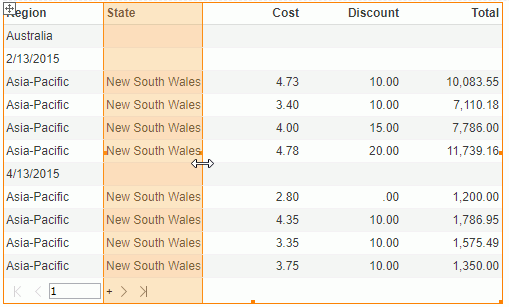
To adjust the width of a column in a table, select anywhere in the column, then select the arrow button  that Server displays on the column header to select the column. Hover over the left or right boundary of the column. When the mouse pointer becomes a double-headed arrow, drag the handle to resize the column.
To adjust the row height in a table, select anywhere in the row, then select the arrow button  that Server displays at the leftmost on the row to select the row. Hover over the upper or lower boundary of a row. When the mouse pointer becomes a double-headed arrow, drag the handle to resize the row height. Then Server resizes all the other rows of the same role too. For example, if you resize a detail row, Server resizes all rows in the detail area. If you resize a group row, Server resizes all rows of the group, while the other groups' rows keep unchanged.
To resize the column or row in a crosstab, drag the right or lower boundary. Then all the columns or rows of the same role change too.
To adjust the panel height in a banded object, select the panel and drag the lower boundary of the panel.
For a tabular, hover over the boundary between two cells until the mouse pointer becomes a double-headed arrow, then drag the boundary to adjust the size of the related cells.
Hiding/Showing a Component
To hide a component, right-click the component, then select Hide on the shortcut menu.
To show the hidden components, go to Menu > Edit > Unhide Components list, and then select the components you want to show.
You can also set the Invisible property in the Inspector panel to show or hide a component. To do this, select the node that represents the component in the report structure tree in the Inspector panel, then set its Invisible property to false or true. If the parent of the component has no data source, you can select the formula button  in the value cell and select a formula from the value list, or select <Edit Expression> to create an expression using the Formula Editor to control whether to show the component.
Using formulas to control showing or hiding components
You can use formulas to control whether to show the components whose parents have no data source in a web report. However, before doing this, you need to first bind a data source to the web report, then create dynamic formulas of Boolean type based on this data source and use these formulas to control the Invisible property of the required components. A return value of true will hide the component.
To use formulas to control which components you want to show in a web report:
- Navigate to Menu > Edit > Bind Data. Server displays the Bind Data dialog box.
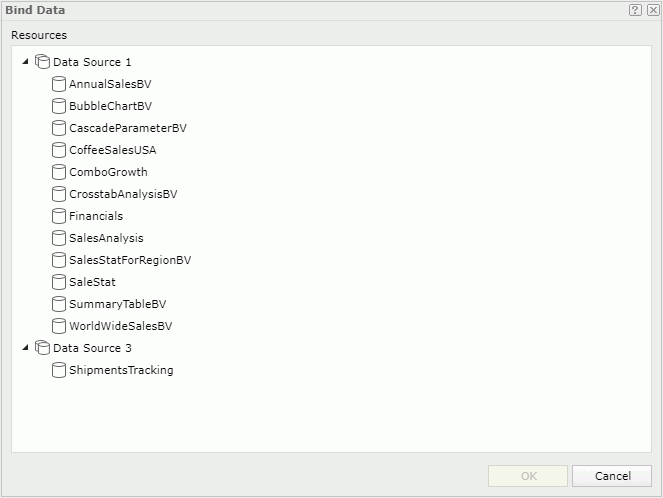
- Select a business view in the current catalog.
- Select OK to bind the business view to the web report.
- Select any blank place in the report. Server displays the business view bound to the report in the Resources panel.
- Follow the steps in Creating and using dynamic formulas to create the formulas you need.
- In the Inspector panel, select the arrow button
 on the upper right corner to show the report structure tree.
 - Select the node that represents the component in the tree.
- In the Properties sheet, select the formula button
 in the value cell of the Invisible property.
 - Select the required formula from the drop-down list, or select <Create Formula> and create a dynamic formula in the bound data source to control the property value.
- Repeat the preceding steps to set the Invisible property of other components.
Then the return values of the specified formulas determine whether to show the components.
If you set the Invisible property of a component to true using a formula, Server does not list the component in the Menu > Edit > Unhide Components list. You can only show it by setting the Invisible property of the component to false. Meanwhile, once you control the Invisible property of a component in a web report by a formula, you cannot change the data source bound to the web report unless you remove the relationship between the formula and the property.
For a web report that you created in Designer, if you have bound it with a data source before you published it to Report Server, and you have created some dynamic formulas based on this data source:
- If the web report uses any of the formulas in Report Designer, you cannot change the bound data source for the web report in Web Report Studio. However, you can use the formulas of Boolean type created in Report Designer or create new formulas based on this data source to control the Invisible property.
- If the web report uses none of the formulas in Report Designer, you can change the bound data source for the web report in Web Report Studio as you want.
Editing a Component
- To edit a label, double-click it and update the text. You can also use the toolbar to format the font, background color, and alignment of a label.
- To edit a table, crosstab, or chart, use the corresponding component wizard on the shortcut menu. For more information, see Manipulating Data Components in Web Report.
- To edit a banded object, select it, select the Edit Template icon
 on the visualization toolbar, and then modify the template. For more information, see Manipulating Data Components in Web Report.
 - To edit an image:
- Right-click the image and select Edit from the shortcut menu. Server displays the Edit Image dialog box.
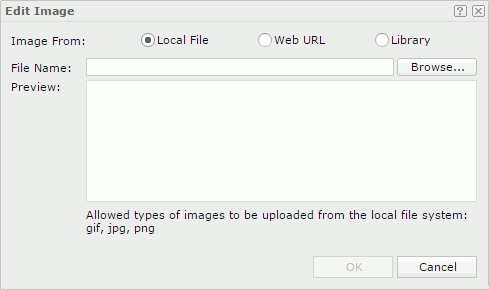
- Specify another image to use.
- To use an image in the local file system, select Local File, then select Browse to find the image.
- To use an image on a website, select Web URL, then type the image URL or paste the URL in the File URL text box.
- To use an image in the image library of Web Report Studio, select Library, then select the image in the My Pictures box.
- Select OK to apply your changes.
- Right-click the image and select Edit from the shortcut menu. Server displays the Edit Image dialog box.
- To edit a multimedia object:
- Right-click the multimedia object and select Edit from the shortcut menu. Server displays the Edit Multimedia dialog box.
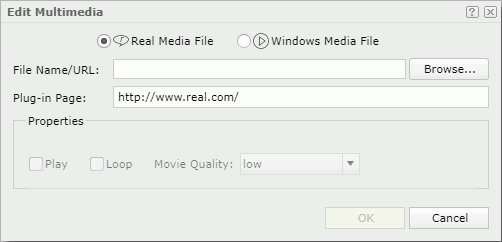
- Choose from the two multimedia object types: Real Media File or Windows Media File.
- Select Browse to select the multimedia object you want to insert if it is on your local drive.
- The Plug-in Page text box provides a default URL from which Server downloads the player to play the inserted multimedia object on a web page.
- In the Properties box, specify the properties for the multimedia object.
- Select OK to apply your changes.
- Right-click the multimedia object and select Edit from the shortcut menu. Server displays the Edit Multimedia dialog box.
- For a tabular, you can edit it as follows:
- Merging tabular cells
You can merge adjacent cells in a tabular which form a rectangle into one cell.To merge adjacent cells, select them one by one while holding the Ctrl key, then select Menu > Format > Merge or select the Merge button
 on the toolbar. Server merges these cells into one cell.
 - Splitting a tabular cell
To split a tabular cell, select the cell and select Menu > Format > Split. Server displays the Split Cell dialog box. Type the number of rows and columns and select OK. You can also select the Split button on the toolbar to split the cell into two cells vertically or horizontally.
- Merging tabular cells
Modifying Component Properties
You can modify component properties using either the corresponding properties dialog box or the Inspector panel.
For some properties you may see a formula button  , which means that you can control the property value by a formula dynamically. Select the formula button
  and then select the drop-down arrow in the value cell. Server displays a drop-down list. You can then select an existing formula in the list or select <Create Formula>/<Edit Expression> to create a formula or an expression using the Formula Editor as the property value.
Modifying Properties Using a Dialog Box
To edit the properties of a component in a report, right-click it and select Properties from the shortcut menu (for a table row, you need to first select anywhere in the row and then select the arrow button  that Server displays at its leftmost to select the row. Then, you can right-click the row to get the Properties command on the shortcut menu). In the corresponding properties dialog box, specify the settings. For more information about the properties dialog boxes, see the specific topics in Web Report Studio Dialog Boxes.
If you want to format the properties of the report, select Menu > Edit > Report Body Properties. Server displays the Report Body Properties dialog box. Configure the properties as you want.
Modifying Properties in the Inspector Panel
The Inspector panel of Web Report Studio is for managing properties of the objects in a web report. To display the panel, select Menu > View > Inspector.
To edit the properties of an object using the Inspector panel, first select the object in the report, or select the arrow button  on the upper right corner of the Inspector panel to show the report structure tree and then select the object from the tree. Server displays all properties of the selected object in the Properties sheet, which contains two columns: Name and Value. Each type of object has its own set of properties. Depending on the object type, the properties that a certain object holds may greatly differ from those of another. You can change how an object appears and behaves by editing its property values. For more information, see Setting Report Object Properties Using the Inspector Panel.
When a report contains a lot of objects, you can make use of the search bar at the top of the report structure tree panel to easily locate an object in the tree.
See the following properties in the search bar:

- Text box
Type the text you want to search in the text box. Server lists the values that contain the matched text. - X Close button
Select to clear the input text. -
 More Options button
Select the button and Server displays more search options.- Highlight All
Select if you want to highlight all matched text. - Match Case
Select if you want to search for text that meets the case of the typed text. - Match Whole Word
Select if you want to search for text that looks the same as the typed text.
- Highlight All
-
 Previous button
Select to go to the previous matched text when you have selected Highlight All. -
 Next button
Select to go to the next matched text when you have selected Highlight All.
Changing the Position Property of Components
Report templates in Web Report Studio use a flow layout model. That is, paragraphs and components in the report body can flow from one page to another, maintaining their sequence, and the Position property controls whether a component is a part of the flow or separates from it. Besides the report body, tabular cells themselves in Web Report Studio can also act as flow layout containers.
In the flow layout model, Server positions objects relative to one another or absolutely. The Position property controls the position of components in the flow layout container. It does not affect components in other areas such as table cells.
You can set the Position property to either value:
- Static
Server positions the component at the location where you inserted it. It disables the X and Y coordinate properties. You cannot move the component other than by moving its insertion point. This can happen when the text flow preceding the insertion point expands. - Absolute
Server locates the component at the position that you specified by dragging or by setting its X and Y coordinate property values. The component insertion point does not change, for instance by inserting text before it.
To change the position property of a component, select the component, then:
- Right-click the component and on the shortcut menu, select the required item from the Position submenu.
- In the Inspector panel, set its Position property value.
![]() The position of an object in a banded object can only be Absolute.
The position of an object in a banded object can only be Absolute.
Removing a Component
You can remove a component from the web report if you no longer need it. To remove a component, right-click it and select Delete from the shortcut menu. If Server prompts a message asking for your confirmation, select Yes to confirm the removal.
You can also remove a KPI chart from its KPI by right-clicking the KPI and then selecting Remove KPI Chart from the shortcut menu.
![]() In a web report, when there is already one tabular, you can neither remove it nor insert another tabular.
In a web report, when there is already one tabular, you can neither remove it nor insert another tabular.
 Previous Topic
 Back to top